Analyze
Ops metrics without leaving your editor
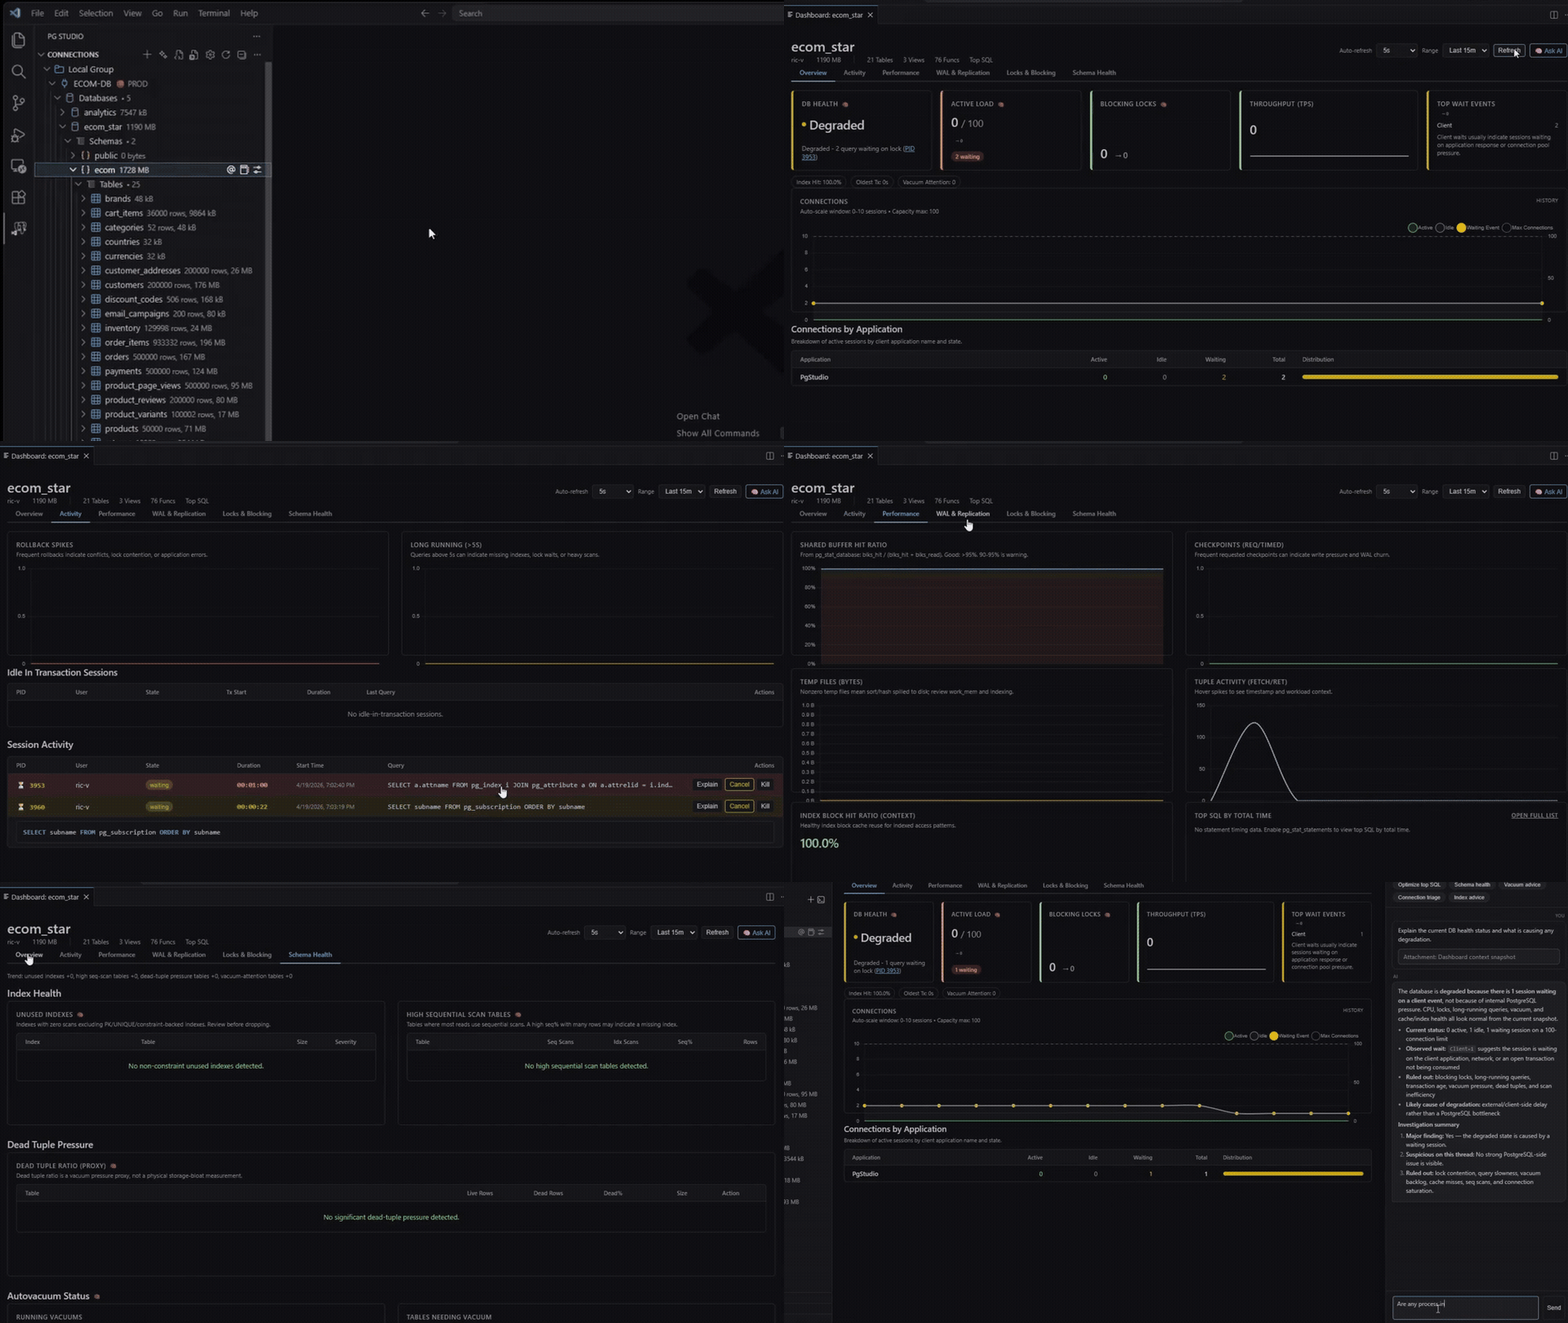
Connections, active queries, locks, cache hit ratio and top tables, refreshed from the pg_stat views. An optional AI health chat answers from the live metrics.
Pro, Sponsor
How you use it
- Open the dashboard from a connection or database
Choose Show Database Dashboard in the tree, or press Ctrl+Alt+D from the palette.
- Watch throughput and contention
Active sessions, wait events and the lock graph show blocking chains before they stall a deploy.
- Drill into slow queries
Jump from a dashboard metric to a notebook with the investigation SQL filled in.
- Back up from the same connection
The backup workspace runs pg_dump and pg_restore with version checks and filtered table dumps.
Key facts
- Plan: Pro, Sponsor
- Connections and active queries
- Locks and wait events
- Top queries and tables
- AI health chat
- pg_dump and pg_restore backup workspace